
Instagram DM Open Rates: What’s Measurable (and What Isn’t)

Vendors quote Instagram DM open rate numbers that look like email. Instagram does not expose a standard open-rate metric to third-party automations the way email ESPs do. If a landing page claims 80–90% opens for AutoDM, treat it as marketing unless they show methodology. CommentLink will not invent an open rate we cannot see.
Read receipts and “seen” are not a campaign analytics API for comment-to-DM. Thread placement (Primary versus Requests) also means a sent DM may never be opened. Counting sends as opens is how fake benchmarks get born. There is no reliable public benchmark for this channel because the denominator is not standard.
What you can measure is closer to five metrics that matter for comment-to-DM: triggers fired, DMs sent, replies, and clicks you tagged. Value over time is automation ROI, not a vanity open. Link hygiene lives in UTM hygiene for Instagram DM links.
Why open rate is the wrong Instagram DM question
Email open rate exists because ESPs inject tracking pixels and still argue about privacy. Instagram does not give comment-to-DM tools that pixel. A “seen” in a personal thread is not a campaign report you can export per keyword. If a vendor will not name the denominator — sends, followers, people who already had a thread — you cannot compare it to your Reel.
The phrase also hides placement. A message in Hidden Requests can be “sent” and never opened. An honest dashboard shows send volume, queue, and the clicks you actually configured. It does not paint a green open percentage to win a comparison table. If finance asks for a single “engagement rate,” give them replies ÷ sends and say what it is. Do not relabel it opens so it looks like email.
What you can see versus what Meta keeps
CommentLink reports work you configure: send volume, queue depth, automation runs, and link-click tracking when you use tagged URLs. It does not report an email-style Instagram DM open rate. Do not expect a column named Opens next to each Private Reply.
Instagram’s own inbox shows you whether a person replied. That is a thread event, not a campaign open. You can count replies in the inbox. You cannot honestly convert that into “72% opened.” People reply without a tracking pixel. People open and never reply. People never find Requests. Story views, Reel plays, and profile visits are not DM opens either. Do not mix those denominators into an AutoDM open-rate slide.
Comment-to-DM examples that measure something real
- Comment LINK. You can count matching comments, DMs sent, and clicks on the lookbook URL with a UTM. You cannot count how many opened the bubble.
- Comment PRICE. You can count replies that ask a size or a city. That is engagement you will staff. It is not an open rate.
- Comment GUIDE plus COLLECT_EMAIL. You can count valid addresses stored. That is a lead. An unopened Requests thread is not.
- Comment BOOK. You can count calendar events with the same UTM. Skip the row if you cannot tie the booking to the post.
In every example the honest sentence is: we sent N, we received R replies, we stored C contacts or clicks. Not: we achieved an open rate of X.
Setting up replies, clicks, and stored leads
- Name the stage before you look at a number: matching comments, DMs sent, replies, tagged clicks, stored emails.
- Put a UTM or unique code on the destination you actually want to count.
- If you collect email or phone in the flow, count completed collects, not prompts shown.
- Once a week, pick one post and write the counts. Compare to last week on a similar post — not to a vendor blog.
- Ignore any screenshot that shows “open rate” without a denominator.
If you cannot tag the URL, do not invent clicks from story views. If you cannot store a contact, do not call a comment a lead. A unique code in the DM that later appears at checkout is measurable. A feeling that “people must have seen it because the Reel did well” is not. Keep the weekly sheet boring on purpose.
Mistakes that invent an Instagram DM open rate
- Sent ÷ comments, labelled “opens.” That is a send rate, and it still ignores Requests.
- Replies ÷ sends, labelled “open rate.” That is a reply rate. Useful. Different word.
- Copying 80–90% from another tool’s marketing page into your board deck.
- Using read receipts on a few friends’ accounts as a campaign metric.
- Assuming Primary placement means opened. It means filed in a different folder.
Better practices than chasing a vanity open
Optimise for findability and replies. Short first lines. Requests education in the caption. One destination. That may increase replies without ever producing an open column.
Optimise for tagged clicks if the job is a file or a shop URL. Optimise for stored emails if the job is a list. Optimise for booked calls if the job is sales. Pick one primary conversion per campaign.
When someone asks “what’s our DM open rate?” answer with the stage you measure and the limitation. That sentence is more useful than a fake percentage. If a board deck needs a comparable, use reply rate and tagged click-through on the same post week over week. Those two numbers move when you fix Requests education and first-line shape. An invented open rate will not.
A weekly measurement template with no open column
- Post or Reel ID and the keyword you taught.
- Matching comments. DMs sent. Queued or dropped if you hit the hour.
- Replies in the thread (they found the message well enough to type).
- Tagged clicks, if the URL was measurable.
- Emails or phones collected, if you collect.
- Sales or bookings you can tie to that post. Blank if you cannot.
No “good” open-rate target. No industry average. Your baseline is last week. If a row is blank, leave it blank.
If two Reels ran the same keyword, do not average them into one open-like number. Placement will differ if one audience already follows you. Keep the sheet at post level. That is the only comparison that teaches you whether the Requests line or the button change did anything.
When to stop asking for an open-rate dashboard
Stop when you notice the number would only exist if you redefined “open” as “sent.” Stop if a vendor wants you to switch tools to get a percentage they still cannot explain. Stop if the team is arguing about opens instead of fixing Hidden Requests tests and UTMs.
Keep measuring sends, replies, clicks, and stored leads. Those move the work. An Instagram DM open rate, as email people mean it, is mostly unmeasurable here. CommentLink will not pretend otherwise.
FAQ
What is a good Instagram DM open rate?
There is no reliable public benchmark because Instagram does not provide a standard open-rate for this channel. Track replies and tagged clicks instead.
Does CommentLink report open rate?
Do not expect an email-style open rate. Use send volume, queue, and click tracking you actually configure.
Can I use read receipts as a proxy?
Not as a campaign metric. A few threads in your own inbox are not a denominator you can report. Count replies and tagged clicks.
If the DM was sent, did they open it?
Unknown. It may sit in Requests or Hidden Requests. Sent is not opened. Do not label send volume as opens.
What should I put on a weekly report instead?
Matching comments, DMs sent, replies, tagged clicks, and contacts you stored. Name the post. Skip any row you cannot tie.
Why do other tools advertise 80–90% opens?
Ask for methodology and the denominator. If they will not say, treat it as marketing. CommentLink will not invent a comparable number.
Related reading
See Instagram DM automation
Comments, Stories, keywords, follow-gates, lead capture and a shared inbox — official Meta APIs.
See DM automationRelated articles
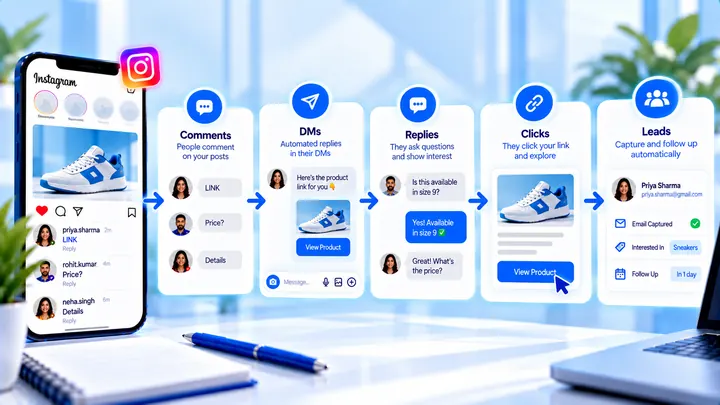
Instagram Comment-to-DM Conversion Rate Explained
Pick a stage: comment→DM, DM→click, click→lead. Do not mix them into one “industry average.”
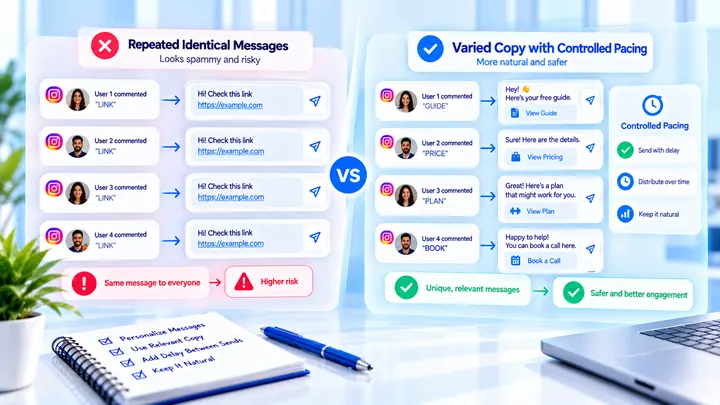
Why the Same Instagram Auto DM Can Hurt Delivery
Sending the same Instagram DM repeatedly at volume can look templated. Variation and pacing matter more than a new vendor.
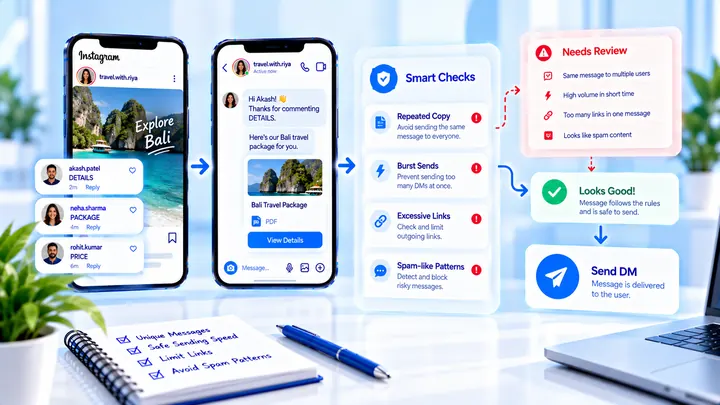
Instagram DM Automation Spam Triggers to Avoid
Avoid Instagram DM automation spam triggers: identical link-heavy first messages, burst sends, and copy that looks like cold outreach.