
5 Metrics That Matter for Comment-to-DM
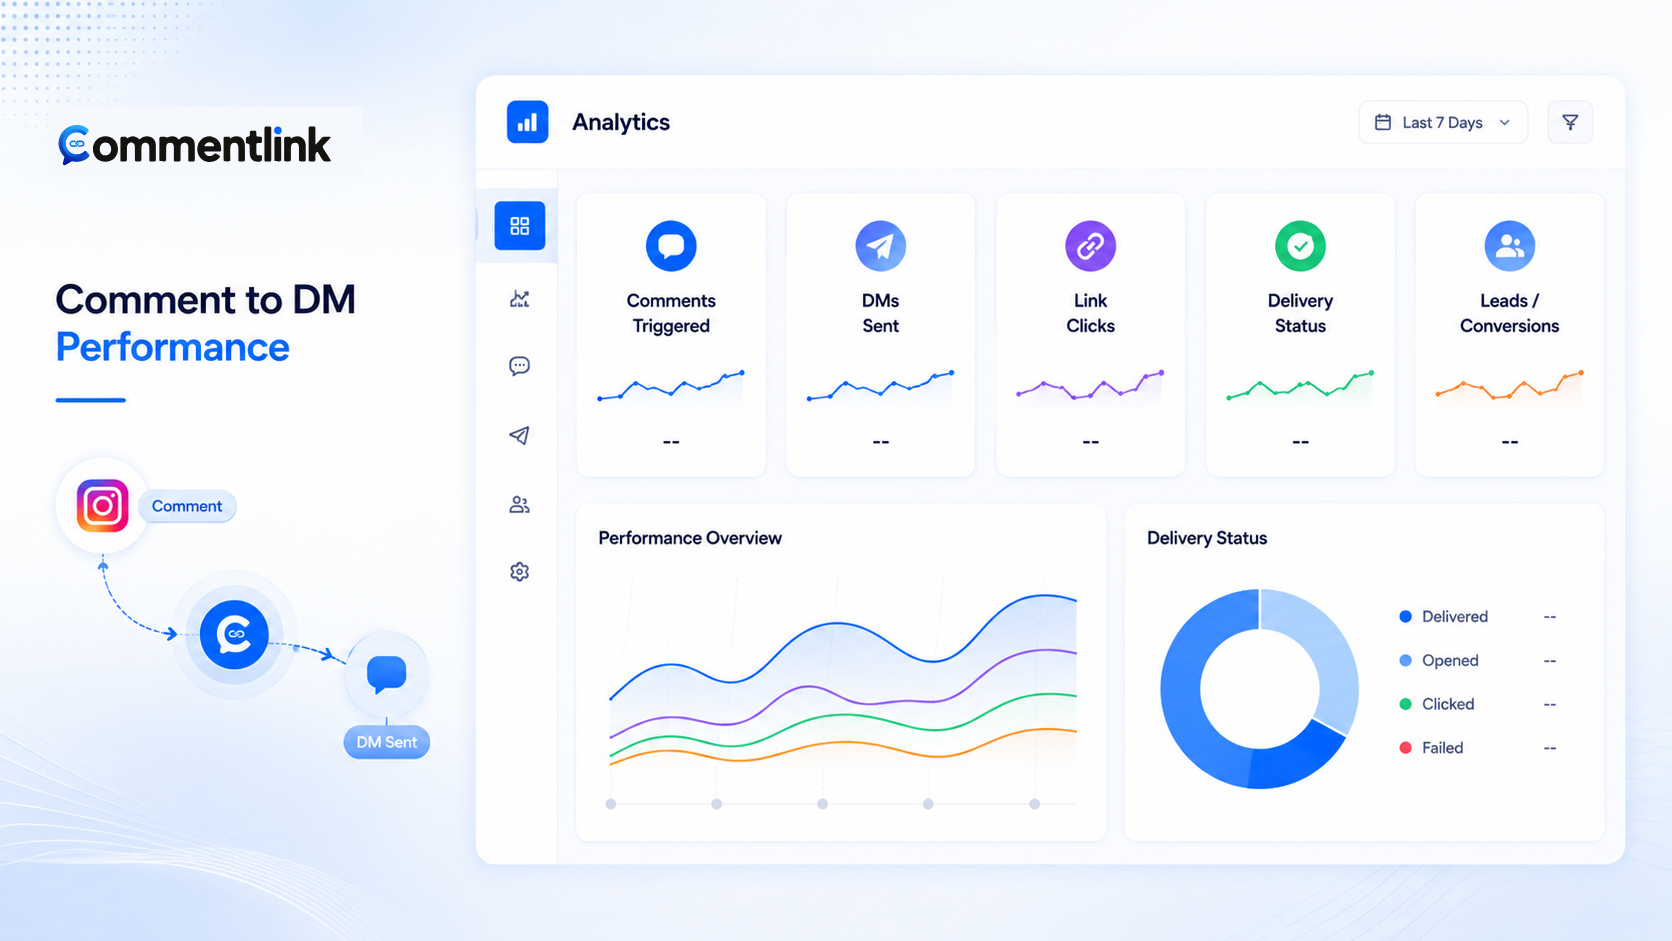
Most comment-to-DM dashboards in ads are theatre: “3× conversions,” “92% open rate,” a testimonial that never happened. Comment to DM metrics that matter are operational. Did the comment match? Did the DM send or wait? Did the follow-gate pass? Did the link get tapped if you track clicks? Did a person reply? CommentLink analytics show messages, automation volume, and link-click tracking. That is not a full attribution stack, and this article will not pretend it is.
1. Matching comments
Start with how many comments hit the rule — exact, contains, exclude, mention-only, or catch-all. If matching is near zero, the caption never taught the keyword, the video never said it, or the rule is too tight. If matching is huge on a meme, you chose catch-all and bought noise. This number is the denominator for everything else. Native Custom Keywords only give you a thinner version of the same idea.
Setup reminders live in automatically DM someone who comments.
2. DMs sent versus queued
Sent is what left through the API. Queued is what is waiting on Instagram’s hourly cap (CommentLink paces about 200 IG DMs per hour per account). Dropped is what native Custom Keywords typically do at the cap, per 2026 explainers. If queued grows during a Reel, the campaign is working and the platform is pacing. If sent is zero, you have a connect, permission, match, or window problem — not a “need more AI” problem. Queue behaviour: viral Reel DM queue.
Do not invent an industry “healthy send rate.” Your Reel is not a benchmark.
3. Follow-gate pass rate
If the gate is on, count how many people got the I’m following card versus how many unlocked after CommentLink read is_user_follow_business. A low pass rate can mean they would not follow, Graph lag, or a private account. A high pass rate on a warm audience can mean the gate was unnecessary friction. Mechanics: how follow gates actually work. We will not publish a fake “average pass rate.”
4. Link taps (if tracked)
If you use CommentLink’s link-click tracking, taps tell you the DM was opened enough to hit the URL. If you use a raw destination with no tracker, you will not get that number from us — look at the shop or the calendar instead. UTM parameters on URLs you control are still allowed; cloaking destinations is not how CommentLink works.
Affiliate links need disclosure more than they need a special metric. See affiliate links in comment-to-DM.
5. Replies
A reply is a person who still needs a human (or a flow that asked a question). It is the quality check. Link-only campaigns can be “successful” with few replies. High replies plus no taps can mean the DM was confusing. Assign those threads in the team inbox. Do not celebrate reply count as engagement if they are all “stop messaging me.”
What CommentLink analytics are — and are not
They cover response-oriented volume: messages, how much automation is sending, link-click tracking, leads captured when you use collect nodes, broadcast performance on WhatsApp. They are not Mixpanel, not a Meta Ads dashboard, and not a source of industry percentiles. If a vendor shows a screenshot with round percentages and no date, it is probably an ad.
A weekly review that does not waste the meeting
- Which post/Reel produced matching comments?
- Sent vs queued — did we hit the hour?
- If gated, unlocks versus cards.
- Clicks if tracked; otherwise shop/calendar conversions you already trust.
- Inbox: open threads, who owns them, anything to close.
What not to put on the dashboard
Do not invent an “industry average DM open rate.” Instagram does not give you email-style opens for these private replies. Do not report a follow-gate pass rate from another vendor’s landing page as if it were yours. Do not treat Message Requests as a tracking pixel. If you cannot see a click, say you cannot see a click and look at the shop instead.
Lead capture counts (email or phone collected in-DM) are real when you use COLLECT_EMAIL / COLLECT_PHONE. They are not “comments converted” unless you define that phrase. WhatsApp broadcast stats belong to WhatsApp campaigns, not to Instagram comment-to-DM. Mixing them in one slide is how leadership funds the wrong channel.
Keyword experiments without fake A/B science
Change one thing: the keyword, the DM first line, or the public reply — not all three the same day. Watch matching comments and clicks (if tracked) on that post. A second Reel is not a control group; it is a different video. You can still learn that LINK outperforms INFO for your shop. You cannot publish a universal ranking of keywords.
Queue depth as a health metric
A growing queue during a spike is success plus physics. A growing queue on a dead post is a stuck worker or a token problem. A zero queue with zero sent and lots of matching comments is a match you are misreading (maybe you counted all comments, not matching ones). Native Business Suite will not show CommentLink’s queue depth; that is a workspace feature, not a Meta dashboard widget.
Story and affiliate extras
Story reply booking uses the same five ideas while the Story is live; after expiry, matching volume collapses. Affiliate campaigns add disclosure quality as a sixth operational check — not a percentage, a yes/no: was the relationship stated? See affiliate links in comment-to-DM and Story booking automation.
How to talk about numbers internally
Write the five metrics on a single page: matching comments, sent, queued, gate unlocks if used, clicks if tracked, replies. Date the page. Do not add a sixth row called “conversion rate” unless you define the formula in the same sentence (clicks over matching comments, or purchases over DMs sent — pick one and keep it).
When leadership asks for a benchmark, say you do not have an industry percentile from this product. Offer a trend: this Reel versus last Reel on the same account. That comparison is honest. A screenshot from another vendor’s ads is not.
If queued stays high after the spike ends, look at errors and tokens, not at copy. If matching is high and sent is zero, look at Professional account, permissions, and keyword. If clicks are missing, you may not have tracking on the URL — look at the shop instead of blaming the DM.
CommentLink analytics are messages, automation volume, and link-click tracking. Use them as counters. Do not dress them up as a growth narrative. The narrative is whether people got the link and whether a human answered the ones who needed a human.
A practical cadence: glance at sent versus queued after every launch, glance at replies every afternoon, glance at clicks weekly if you track them. That is enough to catch a dead token, a bad keyword, or a gate that is costing you more people than it is worth. More charts than that usually wait for a problem you have not named.
A note on Story replies in the same dashboard
Story booking uses the same five counters while the Story is live. After the Story expires, matching volume collapses; do not panic-compare that day to a feed post. Track Story replies separately from Reel comments so you do not “fix” a healthy Reel because a Story died on schedule. CommentLink will not invent a benchmark percentage for either surface.
FAQ
What is a good comment-to-DM conversion rate?
There isn’t a number in this article. Your audience, keyword, and offer decide. Steal process, not fake benchmarks.
Should I track Story replies the same way?
Same five ideas, different trigger. Stories expire, so matching volume dies with the Story. See Story booking automation.
Does native Business Suite give me a queue depth?
Not in the CommentLink sense. You mostly see whether keywords are on.
Can I export a CSV of every metric?
Use what the product shows. This article will not invent an export we did not describe.
Why only five metrics?
Because a sixth vanity chart is how teams stop fixing the keyword.
Where do I see queue depth?
In CommentLink, watch DMs sent versus still queued for that Instagram account. Native Business Suite does not give you this workspace queue. A growing queue on a viral Reel is expected; a growing queue on a dead post is a problem.
Are Message Requests a metric?
They are a delivery location, not a dashboard tile. If people cannot find the DM, fix the public reply line. Do not invent an “open rate” from Requests.
Can I compare my numbers to other shops?
Not from this article. Offers, audiences, and keywords differ. Process transfers; fake percentiles do not.
Should I report a single conversion rate to leadership?
Only if you write the formula next to it. Clicks over matching comments is not purchases over DMs sent. The five operational counters still matter more than a blended percentage nobody can audit.
Related reading
Measure the path from comment to DM
Run comment-to-DM on official APIs, then watch sent versus queued and whether people actually write back.
Turn Comments Into DMsRelated articles

How to Measure Leads from Instagram Comments
A lead from a comment is a contact you can follow up — not a comment count. Wire keyword → DM → email or UTM before you celebrate.
How to Write Automated Instagram DMs That Feel Human
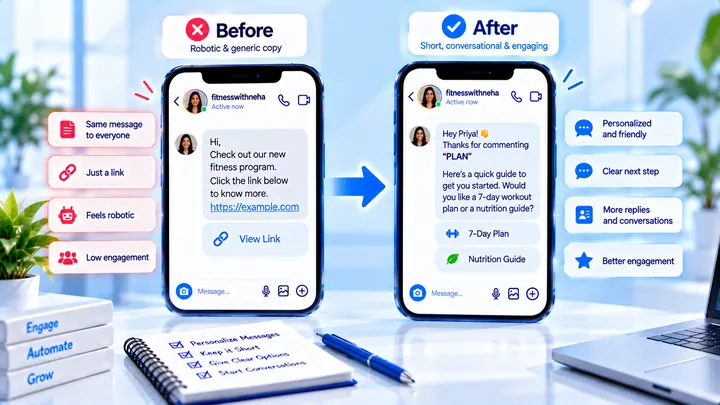
Write human-sounding Instagram automated DMs: short openers, the promised next step, and a CTA that invites a reply — not a pitch wall.
How to Attribute Sales with Coupons in Instagram DMs
Unique codes in automated DMs can beat UTMs when checkout is messy — if you rotate codes and accept some leakage.