
Instagram Automation Dashboard: What to Track Weekly
CommentLink has analytics for messages and automation volume. It is not a full attribution suite. An Instagram automation dashboard for a small team is a weekly habit, not a wall of gauges. Track health of the connection, overflow after spikes, whether rules still point at live posts, and one business outcome you already believe.
If you try to track forty vanity charts, you will miss the token that died on Thursday. This checklist is meant to fit a Friday twenty-minute review. ROI framing lives in how to think about automation ROI. Disconnect behaviour lives in what stops when you unlink Instagram. The dashboard question is: what do we look at every week so those articles do not become post-mortems.
Look at these every week
- Instagram connection still active — tokens and Professional-account login die; automations look “on” while sends are zero.
- Queue depth after spikes — growing during a viral Reel is pacing; growing on a dead post is a stuck worker or a permissions problem.
- Automations still pointed at live media — archived posts, expired Stories, sold-out PDPs still firing last month’s URL.
- One outcome: emails collected, bookings, tagged revenue, or wholesale enquiries you defined. Pick one. Do not rotate the definition weekly.
Write the four lines in a shared note with the date. That note is the dashboard. Native insights views are optional colour, not the headline. If sent is zero and matching comments exist, stop the meeting and fix connect or keyword. If sent is healthy and the outcome is empty, the destination or the offer is the meeting.
Ignore these as headline KPIs
Invented open rates. Instagram does not give you email-style opens on these private replies. Follower count as proof the DM worked. Comment count without sends. Another vendor’s screenshot with round percentages and no date. WhatsApp broadcast stats mixed into Instagram comment-to-DM. Message Requests treated as a tracking pixel.
You can still glance at replies: they are how you know humans are needed. Do not celebrate reply count if they are all “stop messaging me.” You can glance at follow-gate unlocks if you use a gate. Do not make unlocks the company KPI unless the product is the follow.
A twenty-minute Friday ritual
- Open the Instagram connection. If it needs re-auth, do that before you discuss copy.
- Sort automations by recent sends. Pause anything whose media is dead.
- Note queue leftovers. If the spike is over and the queue is still climbing, look at errors.
- Paste one outcome number next to last Friday’s number for the same definition.
- Pick one change for next week: a keyword, a destination, or a paused rule — not all three.
That is the dashboard. If you want post-level ranking, use the by-post sheet from tracking DM leads by post. Do not rebuild it inside a vanity chart you will not open.
Health versus outcome — keep two rows
Health: can we still send? Connection, permissions, queue, scoped media. Outcome: did the sends matter? Leads or revenue you defined. Mixing them produces nonsense like “the dashboard is green” while no one booked, or “the dashboard is red” because a Reel queued for two hours and then drained.
A clothing drop week will look “unhealthy” on queue depth and healthy on tagged checkouts. A quiet B2B week will look healthy on queue (empty) and fine on outcome (three DECK downloads). Do not apply a SaaS spike template to a consultant account.
When the connection dies mid-week
Do not wait for Friday. Zero sends plus matching comments is a same-day page. Re-auth, then test with a second account on a throwaway keyword. Unlinking is a different decision — read what actually stops before you yank the connection as a “fix.”
What CommentLink will not draw for you
It will not draw Mixpanel funnels, Meta Ads ROAS, or a HubSpot lifecycle chart. Tags, collected emails, and HTTP requests exist if you build them. Native CRM sync does not. Put the weekly outcome in the tool you already trust (shop, calendar, sheet). Use CommentLink as the send and queue counters that shop cannot see.
If leadership wants a wall of gauges, give them the four-line note and the by-post table. Extra charts usually wait for a problem you have not named. Name the problem first (dead token, dead URL, spam keyword, Request-folder education) and then pick a chart.
A Friday note you can paste, not a wall of gauges
12 Aug. Connection: active, last re-auth 3 Aug. Queue: 0 leftover after Tuesday’s drop (peak 140, drained by 18:40 IST). Dead media: paused story-04-aug-book (expired). Outcome this week: 18 tagged checkout sessions with utm_campaign=ig-drop-navy — same definition as 5 Aug (11). Change for next week: WAITLIST copy on size 28, not a new keyword.
That paragraph is the dashboard. Native insights views are optional colour. If sent is zero and matching comments exist, stop the meeting and fix connect or keyword. If sent is healthy and the outcome is empty, the destination or the offer is the meeting. Do not open Mixpanel until one of those sentences is true.
Thursday token death is not a Friday agenda item
Zero sends plus matching comments is a same-day page. Re-auth, then test with a second account on a throwaway keyword. Do not wait for the weekly note to discover a Professional-account login that died on Thursday. The Friday ritual assumes health was already watched after launches.
- After every launch: sent versus queued, not a full four-line essay.
- Daily: threads that need a human (refund, fit photo, procurement).
- Friday: connection, leftover queue, dead media, one outcome, one change.
- Never: invented DM open rate as a tile, follower count as proof the DM worked, WhatsApp broadcast stats mixed into Instagram comment-to-DM.
Clothing drop week versus consultant week — same four lines, different shapes
Drop week will look “unhealthy” on queue depth and healthy on tagged checkouts. Write both. A consultant week will look healthy on queue (empty) and fine on three DECK downloads. Do not apply a SaaS spike template to that account and call the dashboard red. The outcome definition does not rotate weekly. If last Friday was tagged checkouts, this Friday is tagged checkouts — not “let’s use comments this time.”
This is ops health plus one business number you already believe. It is not the creator notebook of hours and list growth, and it is not the conversion-rate definition. Those pages exist so this Friday meeting stays four lines. CommentLink will not draw Meta Ads ROAS or a HubSpot lifecycle chart. Put the outcome in the shop, calendar, or sheet you already trust.
Who owns which row so the note actually gets written
Connection and pause: the person who can re-auth, not the intern who “watches insights.” Outcome number: whoever already owns that number in the shop or CRM — they paste it, they do not invent Instagram credit for bio sales. One change: the operator who will edit the DM, not a brainstorm of three new keywords.
If leadership wants a wall of gauges, give them the dated note and the by-post table. Extra charts wait for a named problem: dead token, dead URL, spam keyword, Request-folder education. Name the problem first. CommentLink is the send and queue counters the shop cannot see. It is not a native CRM.
FAQ
What should I track on an Instagram automation dashboard?
Health of the connection, overflow, whether rules still match live posts, and one business outcome.
How often should I look?
After every launch for sent versus queued. Weekly for the four-line note. Daily inbox for threads that need a human.
Is comment volume a dashboard tile?
Only as a clue that a keyword is live. Without sends it is not an automation metric.
Should I track DM open rate?
Not as a headline. You do not get email-style opens. Track clicks if tagged, or the shop/calendar outcome.
What if queue is always zero?
Either you never hit the hour, or nothing is matching. Check the keyword and the media scope before you celebrate “no queue.”
Can I use the same dashboard for WhatsApp?
Keep Instagram comment-to-DM and WhatsApp campaigns on separate rows. Mixing them hides which channel broke.
Is this the same as creator automation metrics?
No. Creators track hours, owned contacts, and tagged clicks in a notebook. This dashboard is connection, overflow, live media, and one outcome for a small team.
What if we already look at conversion rate?
Conversion rate is a stage definition. The weekly note still needs health and one outcome you will not redefine every Friday.
Should queue depth be red during a drop?
Not by itself. Growing during a viral Reel is pacing. Growing on a dead post after the spike is a stuck worker or permissions. Write which one.
Related reading
See Instagram DM automation
Comments, Stories, keywords, follow-gates, lead capture and a shared inbox — official Meta APIs.
See DM automationRelated articles
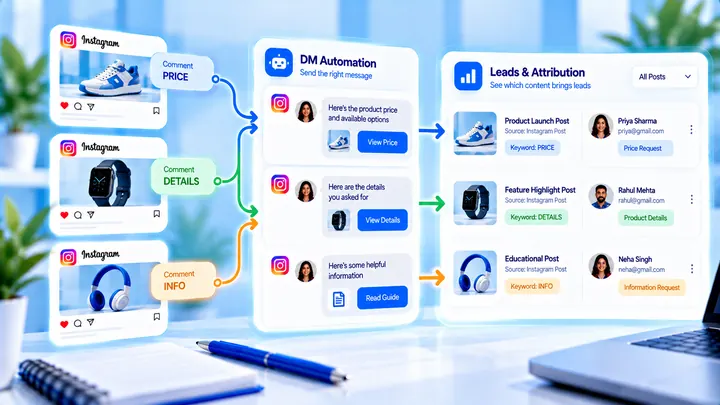
How to Track Instagram DM Leads by Post
Know which Reel created conversations — name campaigns, use UTMs, and do not mix every keyword into one bucket.
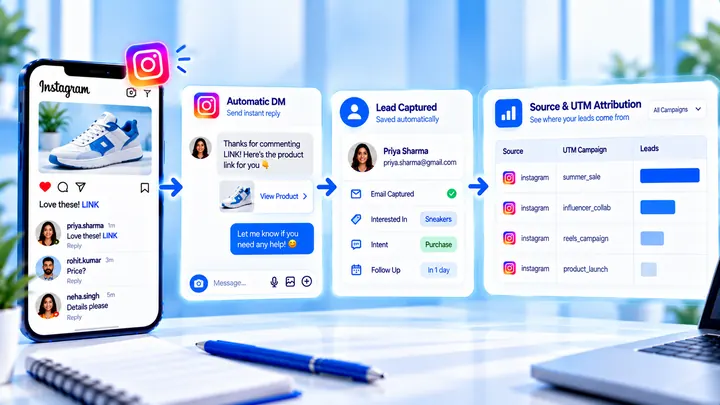
How to Measure Leads from Instagram Comments
A lead from a comment is a contact you can follow up — not a comment count. Wire keyword → DM → email or UTM before you celebrate.
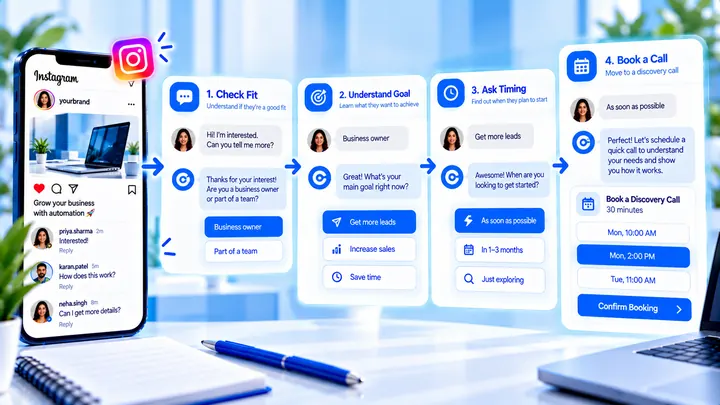
High-Ticket Instagram DM Qualification Scripts
Short qualification scripts for coaches and consultants — protect the calendar without sounding like a loan officer.